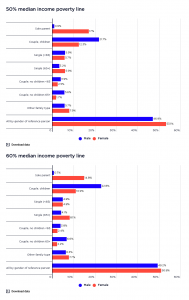
This graph shows the make-up of each income group by age.
2017-18: The largest age-group in every income group are 25-64 year olds, reflecting their greater share of the overall population. However, older individuals are over-represented (66%) in the lowest 40% income group, as are children aged under 15 (45%). Almost half (48%) of people of working age, 25-64 years, were in the highest 40% income group, reflecting that age group’s larger size and greater earning capacity.
2015-16: The largest age-group in every income group are 25-64 year olds. However, older individuals are over-represented (29%) in the lowest 20% income group, and children are over-represented (23%) in the second 20%. In contrast, individuals found in the highest 20% are much more likely to be aged 25-64 years (68%).


