Although the Organisation for Economic and Social Development (OECD) uses the same 50% median income poverty line, differences in research methodology mean that the results are close to but not identical to those reported in this website for Australia.
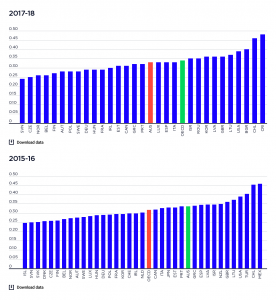
2017-18
This graph shows poverty rates among the Organisation for Economic and Social Development (OECD) countries in 2016, using the 50% median income poverty line. The OECD’s estimate for the overall rate of poverty in Australia according to this graph is 12.1% (compared with our estimate for 2017-18 of 13.6%). This makes Australia’s poverty rate the 16th highest among the 34 OECD countries.
2015-16
This graph shows poverty rates among the Organisation for Economic and Social Development (OECD) countries in 2014-15, using the 50% median income poverty line. The OECD’s estimate for the overall rate of poverty in Australia according to this graph is 12.8% (compared with our estimate for 2015-16 of 13.2%). This makes Australia’s poverty rate the 14th highest among the 34 OECD countries.