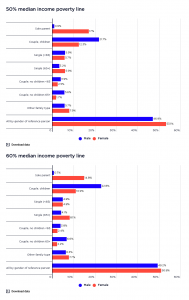
This graph shows the rate of poverty in households by their main income source. It shows that households relying mainly on social security payments are approximately five times more likely to experience poverty than those relying mainly on wages and salaries.
2017-18: Those relying on social security payments represent 36% using the 50% of median income poverty line and 56% using the 60% of median income poverty line, whilst those relying mainly on wages and salary represent 7% using the 50% of median income poverty line and 12% using the 60% of median income poverty line.
2015-16: Those relying on social security payments represent 35% using the 50% of median income poverty line and 56% using the 60% of median income poverty line, whilst those relying mainly on wages and salary represent 7% using the 50% of median income poverty line and 12% using the 60% of median income poverty line.