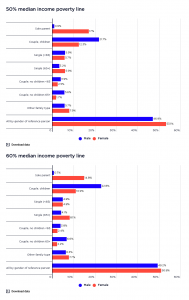
This graph shows the rate of poverty for all people by family type.
2017-18: This shows that the family type with the highest rate of poverty is sole parent families – 35.2% based on the 50% of median income poverty line and 46.9% based on the 60% of median income poverty line. Single persons living alone also have relatively high poverty rates, which reflects their limited opportunity to benefit from economies of scale in living costs and reliance on a single income. When the 50% poverty line is used, single adults under 65 years have a higher rate of poverty (26.6%) than those 65 years and older (26.4%), but these rankings are reversed when the 60% poverty line is used (33.4% compared with 54.6%).
2015-16: This shows that the family type with the highest rate of poverty is sole parent families – 32% based on the 50% of median income poverty line and 43% based on the 60% of median income poverty line. Single persons living alone also have relatively high poverty rates, which reflects their limited opportunity to benefit from economies of scale in living costs and reliance on a single income. When the 50% poverty line is used, single adults under 65 years have a higher rate of poverty (26%) than those 65 years and older (18%), but these rankings are reversed when the 60% poverty line is used (35% compared with 47%).