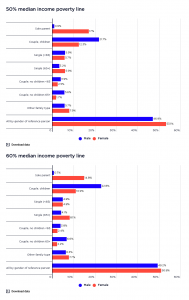
These graphs show the number of people living in poverty divided into binary gender groups according to the 50% and 60% median income poverty lines in 2015-16 and 2017-18. Because this website focuses on household incomes, the gap between male and female poverty rates is much less than the gender gap in personal incomes.
2017-18
This graph shows that a higher share of people in poverty are female – 42.9% compared with 47.1% based on the 50% of median income poverty line, or 53.4% compared with 46.6% using the 60% of median income poverty line.
2015-16
This graph shows that a higher share of people in poverty were female – 51.5% compared with 48.5% based on the 50% of median income poverty line, or 51.9% compared with 48.1% using the 60% of median income poverty line.