New research highlights risk of COVID pandemic increasing inequality
New analysis of inequality in Australia pre-COVID-19 provides a baseline against which to measure the impacts of the pandemic on income and wealth inequality. It highlights the ameliorating effects of timely Government policy responses – including increased Jobseeker and Jobkeeper payments – but warns that the long-term effect of the pandemic on income and wealth inequality will depend on how these policies evolve.
Using the latest available ABS data (2017-18), the ACOSS/UNSW Sydney Poverty and Inequality Partnership Report finds that, pre-COVID, the incomes of those in the highest 20% were 6 times higher than those in the lowest 20%, with that gap widening since 2015-16 (when the ratio was 1:5).
An examination of wealth data shows that, for the first time, average household wealth exceeded $1 million in 2017-18. However, the distribution of wealth in Australia was deeply unequal, with the average wealth of the top 20% ($3,255,000) some 90 times that of the lowest 20% ($36,000). Those in the lowest 10% held $8000 in average net wealth, and the bottom 5% held net debts of $5000.
The report also examines available data on the impacts of COVID 19 on employment and incomes to explore the likely impacts of the pandemic and associated lockdowns on inequality in Australia. It confirms that the pandemic has had a stark impact on those in lower paid jobs, with the average wage of people in the most affected industries half that of people in least affected industries even before the pandemic. The majority of those affected by deep income losses are women and young people.
The data shows that:
- Given the very low wealth holdings of those in the lowest 20%, it would be dangerous to require people spending down on these meagre savings to get them through this crisis. This would place millions of people in extreme financial vulnerability, with little or nothing behind them to weather future shocks.
- COVID-19 will likely further exacerbate income inequality due to the spike in unemployment, with the biggest job losses occurring in lower paid industries. Unless economic recovery strategies focus on job replacements in these areas, including women and young people, and provide an adequate income floor through social security, income inequality is likely to become more severe.
- Wealth inequality has grown strongly over the last 15 years, with people in the highest 20% experiencing extraordinary average growth in wealth of 68%. This is in stark contrast to those in the lowest 20% whose net wealth grew by just 6%, while those in the middle experienced wealth growth of 36%.
The findings lead the Inequality in Australia 2020: Part 1 – Overview report, released today by the Australian Council of Social Service and UNSW Sydney.
Australian Council of Social Service CEO, Cassandra Goldie, said:
“Timely action by the Government to double the unemployment payment with the Coronavirus Supplement and create JobKeeper has temporarily raised the household incomes of people without paid work or at risk of losing their jobs.
“This report shows however that millions of people, pre-COVID, had very little by way of a financial buffer behind them. There is a real danger in now expecting people to spend down on their already meagre savings, in order to survive. We need to support people’s incomes to prevent against dramatically widening both income and wealth inequality and the serious health, economic and social disadvantage that occurs.
We have a choice about whether we prevent rising inequality from the COVID-19 crisis. For example, both the Coronavirus Supplement and JobKeeper Payment for fulltime workers are scheduled to be cut by $150pw from 28 September, and to end after Christmas (for the Supplement) and the end of March (for JobKeeper). The government is also planning to reintroduce assets tests and waiting periods to delay access to income support. Both these policies will drive people into further financial deprivation.
“A substantial, permanent increase in the Jobseeker Payment would ensure that those who cannot get paid work can meet household costs. Well-targeted and jobs-rich economic stimulus could prevent a further increase in unemployment. Permanently removing liquid assets tests and waiting periods to receiving income support are also vital. Applied together these measures will inoculate us against an increase in both income and wealth inequality and support our economic recovery from the pandemic,” said Dr Goldie.
The report’s lead researcher, UNSW Sydney Associate Professor Dr Bruce Bradbury, said:
“Most Australians seem to think that they are ‘middle income’. But middle incomes are lower than generally thought. In part, this stems from a confusion between average wages and average household incomes. A couple with two fulltime average wages ($82,000 each or $164,000 altogether) and with two children is likely to think of themselves in the middle of the household income distribution, when in fact they are more likely to be in the second-highest fifth of living standards. If they don’t have children, they will be in the highest living standard fifth.
“This discrepancy between perceptions and reality arises because many people don’t work full-time, average wages are greater than median wages, and many households, particularly the retired, don’t have any people with earnings."
Professor Carla Treloar, Director of the Social Policy Research Centre at UNSW Sydney, said:
“This report sets a base-line of data against which to assess the impact that COVID19, high unemployment, and government policies to protect incomes and jobs have on the living standards of different groups in the community.
“This analysis is timely and important in setting a baseline against which we can measure the impact of the pandemic on income and wealth inequality in Australia. Increasing inequality need not be an inevitable result of the current crisis. Whether we are ‘all in this together’ or driven further apart will depend on the severity and duration of the crisis and on the effectiveness of the national policy response.”
Key facts:
Income inequality
In 2017-18:
- The highest 20% of households have nearly 6 times the income of the lowest 20%. This gap has grown since 2015-16 when the highest 20% earned 5 times as much as the lowest 20%.
- The average household disposable income for people in the highest 20% of households is $4,166 per week, more than twice the income of the middle 20% ($1,884 per week) and nearly six times that of the lowest 20% ($753 per week).
- The main household income source across all households is wages and salaries (with 78% of all income before tax), followed by 12% from investments, 5% from self-employment and 5% from social security.
- Households in the highest 20% receive almost two-thirds investment income (65%), while those in the lowest 20% receive almost half (47%) of social security income.
In 2020:
- The unemployment rate stood at 7.4% in June 2020 and is expected to rise to 10% in December, assuming lockdowns are progressively eased. The outlook for employment and earnings is very uncertain.
- The industries most affected by the pandemic were twice as likely to employ workers with less than high school qualifications than the least affected industries, according to Melbourne Institute research. Average weekly wages in the most affected industries were less than half (46%) of those in least affected industries, in part due to the high incidence of part-time employment in the former.
- To date, households in the lower half of the income distribution have benefited substantially from the Jobkeeper and COVID Supplement payments, offsetting all or some of the increase in earnings inequality from COVID19 and the lockdowns.
- However, from 28 September this income support is scheduled to be scaled back, with income support for people who are unemployed and the maximum rate of JobKeeper Payment both cut by $150pw. No commitments have yet been made to permanently increase the Jobseeker Payment when the Coronavirus Supplement is scheduled to end after 31 December – reducing payments for unemployed people, students and sole parents on the lowest incomes by another $125pw.
Wealth inequality
In 2017-18:
- Average wealth is relatively high and now exceeds $1 million for the first time ($1,026,000). Of this, 39% is the main home, 21% is superannuation, 20% is shares and other financial assets, 12% is investment real estate, and 9% is other non-financial assets such as cars.
- However, wealth is distributed extremely unequally. The average wealth of the highest 20% of wealth-holders is $3,255,000 – over 90 times the wealth of the lowest 20% (with just $36,000).
- The wealthiest 20% hold almost two-thirds of all household wealth (64%), more than all other households combined.
- From 2003 to 2017, the average wealth of the highest 20% grew by 68% compared with 6% for the lowest 20%. This divergence has been driven by the asset types held by the top 20%: investment property, superannuation and shares. Eighty per cent of financial assets like shares and property investment are held by the highest 20% of wealth-holders.
- At the bottom of the wealth ladder, the most valuable asset holdings of the lowest 20% are ‘other non-financial assets’ such as cars (48% of their wealth holdings) and superannuation (38%). At the top of the ladder, the wealthiest 20% hold relatively less of their wealth in the main home (34%) than those in the middle, and more of it in shares and other financial investments (26%) and investment property (15%).
- The average superannuation wealth of the highest 20% is $496,000 - nine times that of the lowest 20% ($58,000). The top 20% hold 60% of the value of superannuation holdings.
> Use this handy calculator to see where people rank in the Australian income distribution: http://povertyandinequality.acoss.org.au/income-calculator
> Read the report at: http://bit.ly/Inequality2020Overview
> For more information visit: http://povertyandinequality.acoss.org.au/inequality
Social security rate structure
This graph shows the structure of social security payments in 2017-18, the year of the income survey on which the data in this website is based. These are not current payment rates.
New report shows women with caring responsibilities at greater risk of poverty before COVID-19 and highlights risks of ‘snapback’
New analysis of poverty in Australia finds that, before COVID-19, households with children with a female main income earner were more than twice as likely to live in poverty as those in which the main income earner was male, highlighting the impact of caring roles on poverty in Australia. The report also finds that people who were unemployed were at greatest risk of poverty, with two-thirds of people in affected households living below the poverty line. The report’s findings confirm, once again, the inadequacy of pre-COVID payments for people who are unemployed.
The findings lead the Poverty in Australia 2020: Part 2 – Who is affected? report, released today by the Australian Council of Social Service and UNSW Sydney. The report compares the impact of poverty on different people in the community, broken down by age, family type income source, and labour market and housing status. It includes estimates of poverty among people with disability and those from culturally and ethnically diverse communities. The report, which analyses Australian Bureau of Statistics (ABS) data from 2017-18, provides a baseline against which to measure the impact of the current COVID-19 pandemic on poverty in Australia.
Australian Council of Social Service Acting CEO, Jacqueline Phillips, said:
“This report exposes the disproportionate impact of poverty on households in which women are the main income earners. These households are twice as likely to live in poverty as those in which men are the main income earners (19% and 10%, respectively), with the gap even higher in households with children (at 23% and 10% respectively).
“Disturbingly, more than a third of single mothers and their children are living in poverty (37%). The challenges faced by single mothers that lead to so many being on low incomes have serious implications for the wellbeing of those women and their children.
“Early indications suggest that women have been suffering some of the worst economic impacts of the current pandemic, and effective policy action is needed to ensure this does not translate into an ongoing reduction in female employment or an increase in poverty amongst women and children. A snapback on childcare or income support risks trapping single mothers and their children in poverty.”
Poverty rates vary a great deal among different groups. The main reasons for this are also three main drivers of poverty: access to employment, the level of public income support available to people with low or no incomes, and housing costs.
“People who were unemployed were at greatest risk of poverty, with two-thirds of affected households living below the poverty line, highlighting the gross inadequacy of the $40 a day unemployment payment pre-COVID. The doubling of JobSeeker as part of the COVID-19 response has transformed people’s lives. The Government must now ensure that the pathway out of the pandemic is also a pathway out of poverty by setting a permanent income floor above the poverty line,” said Ms Phillips.
“The report reveals that renters are almost twice as likely to live in poverty as home-owners (19% compared with 9%) with public housing tenants at greatest risk (58%). The very high proportion of public housing tenants living in poverty reflects the disadvantage they face, the highly targeted nature of public housing and the low rates of income support payments pre-pandemic.
“The Government can reduce poverty by permanently lifting social security payments above poverty levels, boosting jobs growth, investing in social housing and ensuring that childcare is available for all families who need it for the duration of the economic recovery and beyond.”
The report’s lead researcher, UNSW Sydney Associate Professor Dr Bruce Bradbury, said:
“This report shows the impact that a lack of paid work and having to rely on income support has on poverty. The high poverty rates among income support recipients in 2017-18 point to what will happen to a much wider section of the population if the current COVID-19 income support payments cease in September without an adequate replacement.
“As of January 2018, the single rate of Newstart (plus rent assistance) was $117 below the disposable income poverty line ($185pw if they did not receive Rent Assistance). Consequently, around two thirds of households where the reference person was unemployed were in poverty after taking account of housing costs. Similarly, more than half of households reliant on Parenting Payment were below the poverty line.
“Pension increases in 2009, together with home ownership, mean that only 10 per cent of people aged 65 and above were living below the poverty line. However, among older renters, 41percent had incomes after housing costs which were below the poverty line.”
Professor Carla Treloar, Director of the Social Policy Research Centre at UNSW Sydney, said:
“This report shines a light on those groups most at risk of poverty in Australia and reveals its disproportionate impact on women and children and those who are not currently in paid work.
“The question is, now that we have the data, what will we do to provide the safety net that’s needed to lift these households out of poverty?
“We can see in recent months how doubling unemployment payments has dramatically improved life for people who have lost their jobs. It’s clear we must continue the action on income support, and devise solutions on housing and job creation to lift more people out of poverty.”
Key facts:
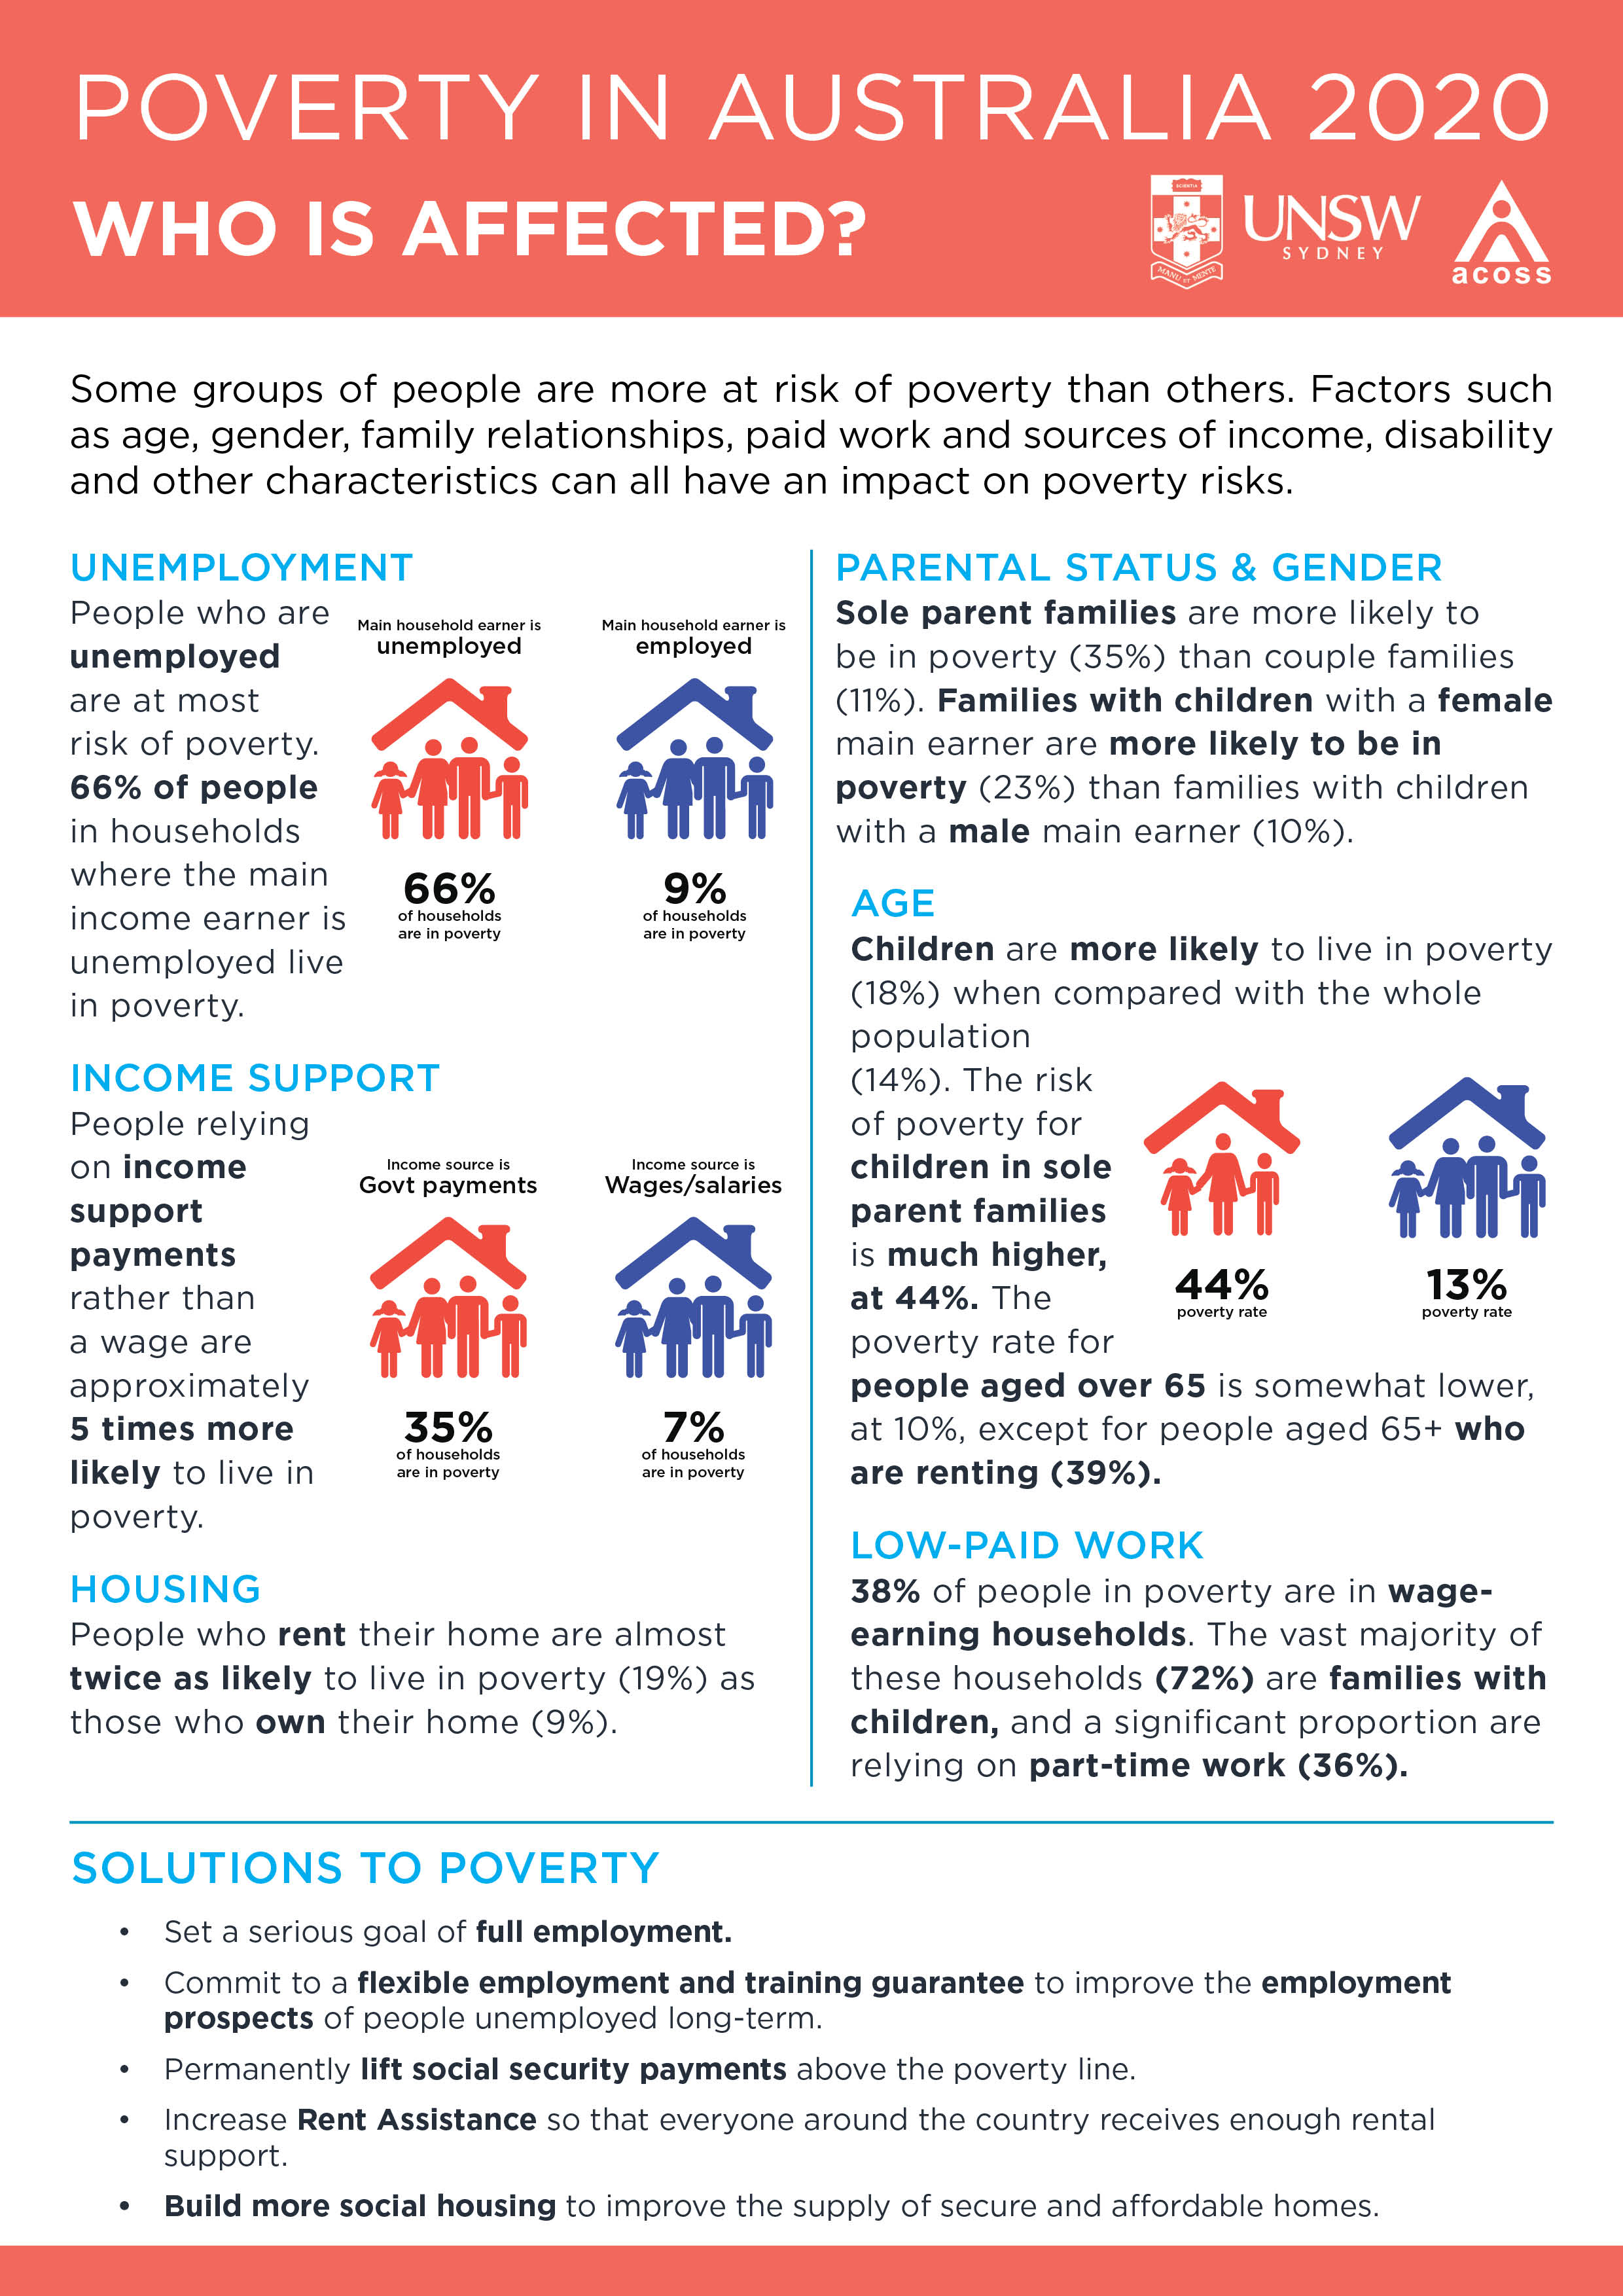
- Being unemployed remains the greatest poverty risk factor, with two thirds (66%) of people in households in which the main earner is unemployed living below the poverty line. This is directly related to the level of pre-pandemic income support payments.
- The single rate of Newstart in January 2018 (including Rent Assistance and Energy Supplement) was $117pw below the poverty line ($185pw if they did not receive Rent Assistance). Youth Allowance (plus these supplements) was $164pw below the poverty line ($232pw without Rent Assistance).
- Households that have to rely mainly on social security payments (e.g. unemployment, parenting, and disability payments) are five times more likely to experience poverty (36%) than those receiving most income from wages and salaries (7%). However, 38% of those in poverty are in wage-earning households; the majority of whom are households with children.
- In households where the main earner is a female, the poverty rate is 19% – almost double the rate when the main earner is male – 10%.
- In single parent families in which the main earner is a woman the rate of poverty (37%) is twice that in which the main earner is a man (18%).
- The biggest differences in poverty rates between households with male and female main earners are in families with children. The average poverty rate among people in families with children where the main income-earner is female is 23%, compared with 10% where the main income-earner is male (which is the more common arrangement). In contrast, among households without children, the average poverty rate where the main income-earner is female is 12%, compared with 10% where the main income-earner is male.
- Nearly half the children in sole parent families live in poverty (44%) compared with 13% for children living with both parents.
- While those of working age are at greater risk of poverty than older people, over 65s who are living in private rental face a relatively high risk of poverty (41%).
- Renters are almost twice as likely to live in poverty as home-owners (19% compared with 9%) with public housing tenants at greatest risk (58%).
Read the report at: https://bit.ly/PovinAuspt2
Profile of poverty by gender of household reference person
This graph shows the household types of people in poverty by gender of household reference person.
It shows that shows that among people in poverty in older single-person households (65 years and over), women greatly outnumber men (comprising 6% of all people in poverty when the 50% of median income poverty line is used, and 8% using the 60% median income poverty line; compared with 3% who are older single men - 4% using the 60% median income poverty line). However, among people in poverty in older couple households, more are found in households with a male main earner (comprising 6% of all people in poverty according to the 50% median income poverty line and 7% according to the 60% median income poverty line, compared with 2% in older couple households with a female main earner according to both poverty lines), reflecting the predominance of couples with a male main earner in that age group.
