This shows the profile of adults in poverty by their type of housing occupation – whether they own their home with or without a mortgage; whether they rent either privately or publicly; or whether they have another form of occupation type.
2017-18
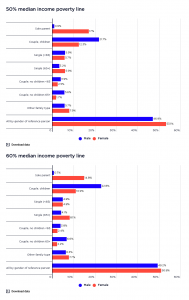
This graph shows that approximately half of all households living below the poverty line were renting, at 49% using the 50% median income poverty line and 45% using the 60% median income poverty line.
2015-16
This graph shows that approximately half of all households living below the poverty line were renting, at 53% using the 50% median income poverty line and 47% using the 60% median income poverty line. This shows that renters are over-represented among households in poverty, because only 31% of all households were renting in 2016.